Popular Immiseration
Five named indicators from The Independent Manifesto's structural-demographic checklist. This is the chart: not absolute poverty, but a declining trajectory across the bottom 90%.
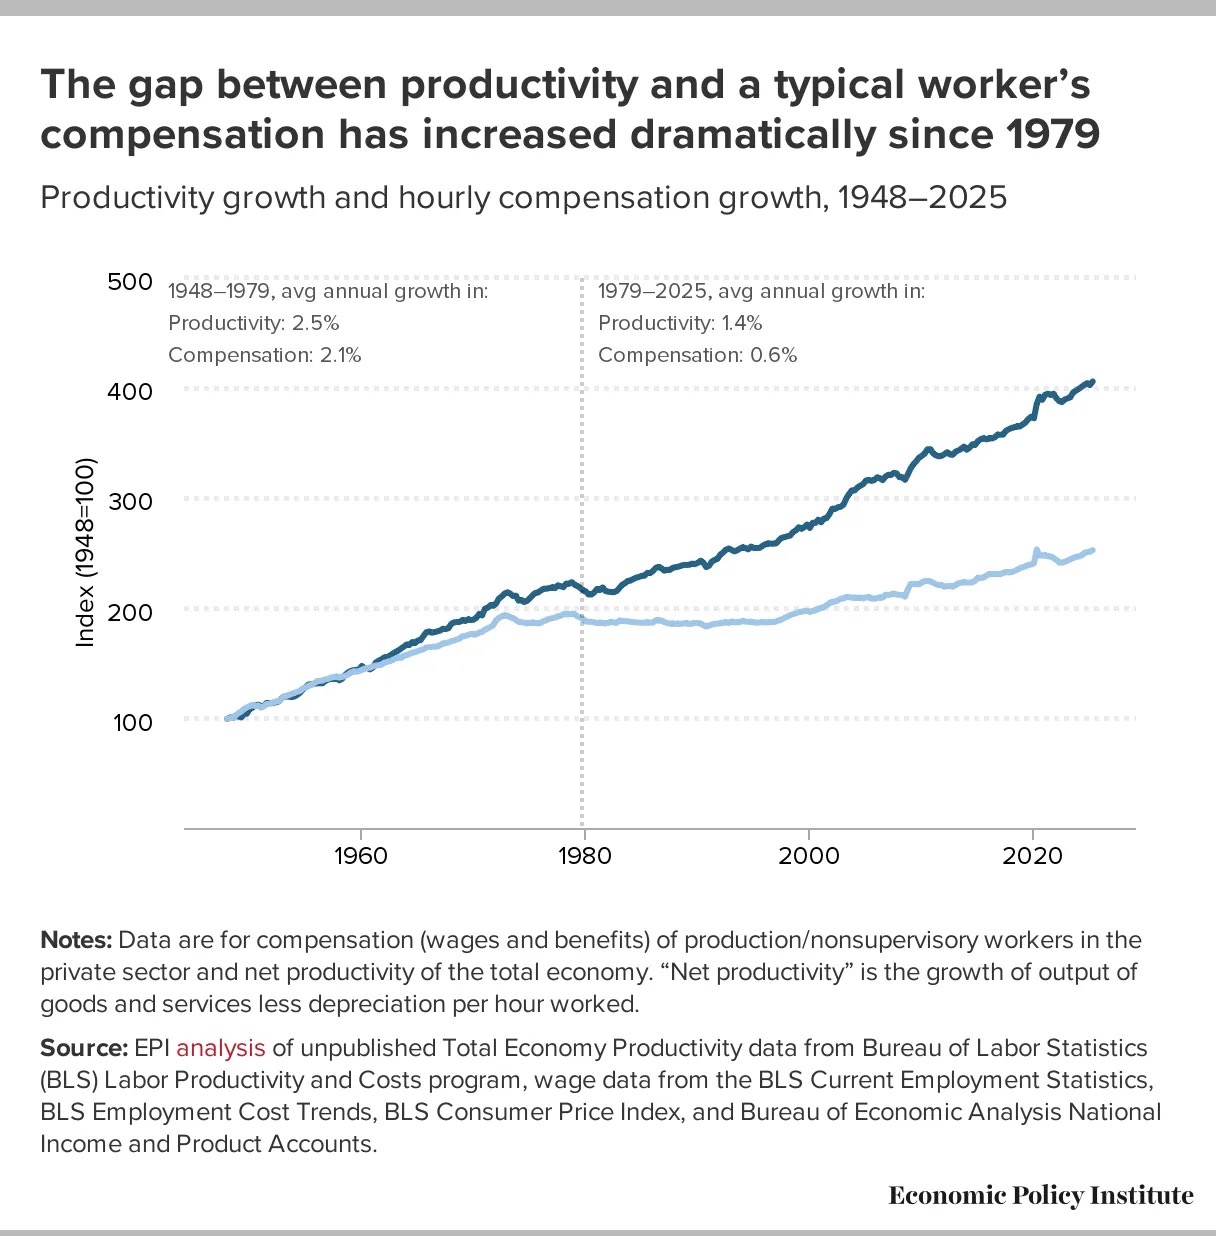
1948–1979: productivity grew 2.5%/yr, compensation 2.1%/yr — nearly locked together. 1979–2025: productivity grew 1.4%/yr, compensation only 0.6%/yr. The gap is the mechanism, not a side effect.
Source: Economic Policy Institute, epi.org/productivity-pay-gap. EPI analysis of unpublished BLS Total Economy Productivity data, BLS Current Employment Statistics, BLS Employment Cost Trends, BLS Consumer Price Index, and BEA National Income and Product Accounts. Static image, not a live feed — EPI updates this chart periodically, not via API.
Deaths of despair — suicide, drug overdose, alcohol-related deaths — rose from 28.6 per 100,000 in 1999 to a peak of 72.0 per 100,000 (198,266 deaths) in 2023, then fell 16% in 2024, the first significant decline since 1999. Source: CDC WONDER.
Life expectancy at birth reached 79.0 years in 2024, the highest mark in US history, up from 78.4 in 2023 — driven by falling death rates from heart disease, cancer, and drug overdoses as the pandemic's effect receded. Source: CDC/NCHS.
52% of Americans ages 18–29 now live with a parent or grandparent, the highest share since the 1940s — not driven by unemployment, which sits well below its post-2010 peak for this age group. The median US home price hit $430,000 in 2025, up 34.4% since 2019. Source: Pew, BLS, Realtor.com.